Dice Rolling with the Microbit
Elementary Statistics (Microbit)
In this activity, we will introduce arrays to store and display a count of dice rolls using random numbers from the Micro:bit.
Activity
We can generate random numbers using the Micro:bit. In another activity, you can explore how these random numbers are calculated by a computer, but this is actually built into the Micro:bit as a step (also called a "function") that you can use anytime you like with just a single block. You can tell the random number step the range of values you want (for example, between 1 and 10); these numbers are called the function’s "parameters", since you can decide what they are every time you call the function with the pick random number step.
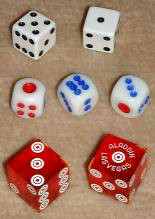
We will choose a random number to represent a 6-sided die roll. So, the values could be between 1 and 6. We will also keep track of how many times we saw each value.
Getting Started
Begin by rolling a die 10 times, and create a table that counts how many of each die side you see, like this:
| 1 | 2 | 3 | 4 | 5 | 6 |
|---|---|---|---|---|---|
| 0 | 0 | 0 | 0 | 0 | 0 |
How far apart is your distribution of die rolls? In other words, what is the largest count minus the smallest count - how many more times did you see the die number that appeared the most often, than you saw the die number that appeared the least often? In theory, you should see any value about the same amount as any other, and if you roll the die enough times, this "spread" will get closer to 0 as the die rolls even out. Try rolling 10 more times and see. Compare this with the rest of the class - who had the largest spread, and the smallest spread?
On Start
We can use variables to keep track of values in the microbit. However, we are not looking to create a single number or text variable this time, but rather a whole table of values. We could do this by creating a variable for each face of the die, but that’s a lot of work! We can create an array, which is a single variable that represents a collection or table of values.
Creating an Array to Represent the Table of Counts
Begin by creating a variable (I called mine counts). In the on start block, add a step to set this variable to a value. For the value, fill in an array of block. Use the plus sign to create six values (one for each die face), and set each one to 0. That’s it! an array is just another type of variable.
Rolling a Die
Create a variable to represent the current die roll. I called this roll. When the A button is pressed, set the roll variable to a random number. There are 6 sides on the die, but we’re going to set our random number from 0 to 5.
This is because the array numbers its slots - notice there are 6 of them, one to count how many of each die face value we see, just like in your original table. Arrays start numbering their slots from 0, so our 1 through 6 is really counted as 0 through 5. That might sound confusing, but if you look at the houses on your block, they also might not start at 1. Some blocks number from 100, or from any number like 3501. 0 is a number, so why leave it out? Computers often count starting at 0. That’s no big deal for us: how can we shift our die roll so that it is from 1 to 6 instead of 0 to 5?
Now that we have our die roll variable set to a value from 0 to 5, let’s update our table. When you rolled a 3, what did you do with your table? In the same way, we’re going to update the third counter column value by 1. To do that, we will get the value of the counts array at the roll column, add 1 to it, and then set the value of counts at the same roll position. So, for example, if there was a 1 in that position, we’re going to make it a 2.
To create this step, you’ll need 3 pieces: the array counts set value at step, a counts get value at step, and an add step. The get step will take the value at roll and add it to 1, and the set step will set the value at roll to this newly added value. Since the roll variable is a number from 0 to 5, and the array has six items (also numbered 0 through 5), this works out perfectly.
Plotting the Counts
Let’s visualize the array on the LED screen. In the forever block, add six plot steps (one for each of our counts). Set each one to plot x as 0, 1, 2, 3, 4, and 5. For y, you can use a counts get value at step to get each item from the table (again, fill in 0, 1, 2, 3, 4, and 5 for the value at parameter).
Run you program and press the A button a few times. You should see the plot fill in slowly. The first column of lights is how many times you’ve seen a die roll of 1; the second column is how many 2’s, and so on. Do they fill in evenly? What is the largest spread that you see?
Improving the Display
You might notice that the first row of lights is filled in on the LED when the program starts, even though you didn’t roll the die yet by pressing A! Why is this? Remember that computers and mathematicians like to count things starting from 0, so the first row is actually 0. So when you haven’t seen any die rolls yet, the 0 line fills in using our forever block. How can we fix that?
Change the forever block to subtract 1 from each of the counts get value at steps, and your display should start out empty. What’s really happening is that our 0 value becomes -1, but the Micro:bit doesn’t display negative numbers on the plot, so it skips those, leaving your display empty until you actually click the A button.
Resetting the Counter
One limitation of the LED display is that it only has a few rows. Once it fills up, you won’t know how many of each dice you rolled. Add a block on button B pressed, where we will reset the counters and the display. Add a clear screen step, and six steps of counts set value at to set all six values of the counts array to 0. When your die counts fill up the screen, you can use the B button to reset them.
The Finished Project
Here’s my finished product, available at https://www.billmongan.com/dice/:

Extension: Displaying the Dice Value
Try displaying a dice pattern each time you generate a random number. You can use the if block to check if the random number value is equal to 1, 2, 3, and so on. Depending on which value, you can show a certain LED pattern that looks like each dice. Make sure to use the clear screen step to clear the LED again when it plots the output.
So that the plot output doesn’t overlap with the dice, you can move the plot steps to the on A+B button pressed, so you can choose when this is displayed.